
Spreadsheets
TLDR: Spreadsheets are great, and with a few improved design decisions, have the potential to replace forms, bespoke databases, and many websites. In Utopia they are the central tool for data management, including for high-power data analysis and software development.
Prerequisites: Customizable Software
The very first “killer app” was VisiCalc for the Apple II — the first instance of modern spreadsheet software. While some earlier software for managing tables of numbers existed, VisiCalc offered several important innovations, such as an interactive interface with numbers that would be automatically computed according to formulae that referenced other cells. In the two years following its release, sales of the Apple II exploded, going from 35k units in 1979, the year before, to 78k in 1980 and then on to 180k units sold in 1981, with many customers saying that they were buying the machine specifically to use VisiCalc. The humble spreadsheet turned personal computers from a hobby gadget to a business tool.

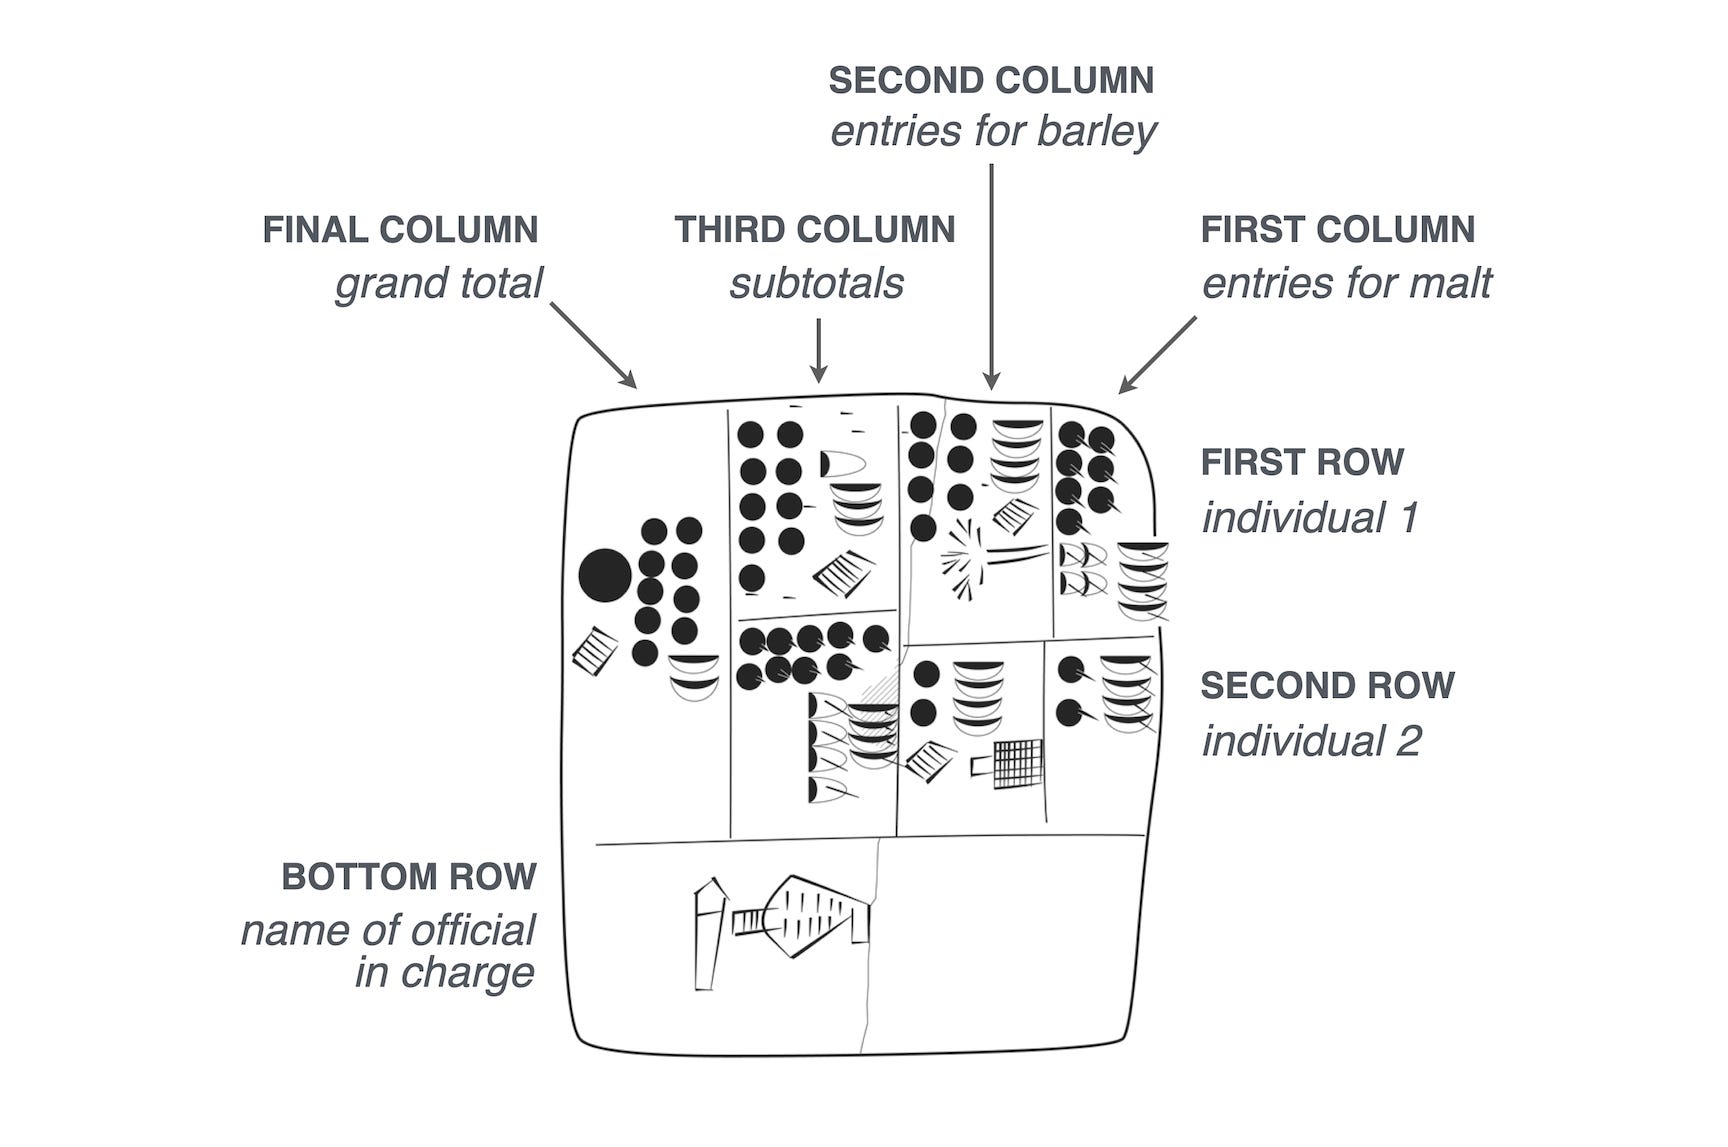
Over the following 46 years, many innovations have been added to digital spreadsheets — advanced statistical analyses, better formatting, generated graphs/charts, cloud-based storage, multi-user collaboration — but the basic structure has remained remarkably consistent. This is because the underlying concept of organizing data into tables is ancient. Some of the earliest written records are accounting ledgers and mathematical formulae from Sumer (in what is now Iraq) dated at over five thousand years ago.
But despite the rock-solid core design and a strong personal sense of affection, I claim that spreadsheets are bad! Or, to be more specific, the modern spreadsheet software paradigm sits on a bunch of bad design decisions that I claim are not present in Utopia. We can have clean, principled, beautiful tables in so many more places, if only we open our mind to the possibilities.
Essentia Tabulae
Tables are great. Not only are they the most natural1 way to organize discrete information in two dimensions (i.e. the space of the visual field), but they’re even a fairly natural mathematical object with very simple rules. On the most basic level they involve:
numbers that are arranged relative to each other
a format for each number that says how to render it
A key insight is that these two aspects are both foundational and extremely potent.
For instance, many would say that the ability to put text into cells is important, but text is secretly just a number that's been formatted to look a certain way.2 Currencies, levels of precision, and style choices are all easy to see as formatting questions, but observe that we can also interpret formulae as having a “rendering format” that makes the expression “=2+2” appear as “4.” The value of the cell hasn't really changed — it's simply being interpreted in a clever way, much like plain text.
Notice, also, that I said the numbers are arranged “relative to each other” rather than “in a grid of rows and columns.” This is because 2D tables are only one specific version of the core idea. Lists, for example, can work like 1D spreadsheets. And in fact, if we roll with the idea that lists are a kind of spreadsheet, we can see tables as a list of columns, each of which is a list of rows (or vice versa3). While it might seem like this violates the notion that cells contain numbers, mathematics tells us that lists of numbers are also numbers, just with a non-standard format.4
This insight also reveals that modern spreadsheets are secretly 3D! The tabs on a spreadsheet doc essentially create a list of tables, where we can think of each table as a number with a particular format. If spreadsheet software acknowledged this point better, it would allow users to go even further, allowing “tabs” to be organized into a table, or a list of tables, or a table of tables, and so on.
Form and Function
The stock answer for “what is a spreadsheet for” is: organization, analysis, and storage of data. But this is blind to several important aspects.
For starters, spreadsheets are used for data entry. This is almost so obvious as to become invisible. Of course we can enter data directly into the table! This has been true since VisiCalc! Imagine how clunky it would be to need to modify a separate file to change a spreadsheet’s data, or use a separate program to change something. Modern spreadsheets even offer tools for controlling how data is entered, such as drop-down menus or validation checks.
But in many instances, data entry doesn't happen in the spreadsheet itself — it happens via form, such as with Google Forms, or a similar piece of software. Most forms are basically just a collection of labeled fields. If spreadsheet software developers were just a little bit more ambitious, especially in allowing styling to make spreadsheets look nicer, I claim that 90% of data entry that currently involves a form could happen directly on the spreadsheet.
This brings us naturally to another neglected use case: data sharing. The main reasons that people don't use spreadsheets for collecting data from others are privacy and security. In all the spreadsheet software that I’m aware of, it’s only possible to restrict visibility or edit power to the entire spreadsheet. This is an obvious oversight. Spreadsheet owners should have the power to mark cells/rows/tables as needing different permissions, either as a whitelist and/or a blacklist. A standard form could then be replicated by granting each unique user (besides the special users like the owner) permission to edit only a single row, and perhaps only for a limited timeframe.
But perhaps the biggest blind spot doesn’t concern neglected features of everyday spreadsheets, but rather the software that was built because standard spreadsheets are lacking. Database systems (queried with languages like SQL) and notebook environments (eg Jupyter) largely arose to deliver speed and scale that spreadsheets struggle to match. Why are spreadsheets so slow? There are two main reasons:
Interactivity — Spreadsheet users expect the values of cells to update instantly whenever they make a change, which can mean scanning the entire sheet to update references, recompute summary statistics like averages, and update conditional formatting. Often, a change in one place will trigger a successive series of downstream updates, which can quickly slow down even a modern machine.
Flexibility — Spreadsheet cells are typically represented basically as text. Users, for example, don’t need to clarify that “0.17” is a number, rather than a string of four characters, when they type it in. This can get rid of a lot of bureaucracy for the user, but it ultimately prevents the machine from packing cell data into more efficient formats like dense arrays and processing it in parallel. Similarly, functions like VLOOKUP, RAND, and TODAY are powerful, but in conjunction with the interactivity, often result in volatile cells that need to be constantly recomputed.
The great irony is that if spreadsheet developers had decided to allow users to turn off features like instant-recalculation or the ability to insert text anywhere, they likely could have produced a more general-purpose data analysis tool that’s capable of efficiently doing everything from adding two values, to creating 3D visualizations of multivariate polynomial regressions.

Utopian Spreadsheets
My vision for spreadsheets in Utopia starts with a single cell. Each cell has some data, a type, and a set of formatting modifiers (the type and modifiers are collectively called “the format”). Types are drawn from a small set of options, including integers, rational numbers, and strings. Data is always, conceptually, a natural number that defaults to 0. Basic formatting modifiers include making the cell render in a bold font, or with a different color background (modifiers are allowed to be mutually exclusive).
While I’m mostly not going to be focusing too much on interface and presentation, since as part of the culture of customization, Utopia allows a variety of different editing programs with a variety of different interfaces to edit the same basic data structure. But I think it’s worth imagining a portion of the screen describing the selected cell, topped by a drop-down menu for type, then having a field where data can be entered, and then having a collection of buttons, and other toggle options for modifiers that are either on or off.5

The default cell type is a sparse, infinite, bi-directional list. In other words, if we consider a single default cell, we can imagine it to be a list of infinite items, each of which are default cells, which can be seen as lists of infinite default cells, and so on. In this way, when one creates a new spreadsheet, it can be seen as a single cell or as an infinite dimensional array with infinite size in each dimension.
Using modifiers, one can change the default format of sub-cells. In this way, one could re-create a 2D spreadsheet much like the ones of Earth by specifying that the sheet is a list of columns, which are each, by default, a list of strings. But this still won’t be a perfect reproduction — Earth’s spreadsheets are finite size. (Google Sheets, for example, defaults to 1000 rows and 26 columns.) To match this more accurately, one can use another basic type of cell: a dense list. Dense lists have a finite number of elements, and thus a dense list of dense lists will have a “top left corner” which we could call “A1.”
Utopian spreadsheets start indexing at 0, not 1, of course. And nobody would label columns things like “A” or especially “AA” as the column after “Z”.6 Earth’s notion of the cell “A1” would simply be “0,0” in Utopia. But references to cells by using an address like “0,0” are rare, because a common modifier that a cell (and thus a column or sheet) can be given is a name. Thus instead of putting the string “Profit” as the first cell in the column where profits are marked, the entire column is given the name “Profit” and can be treated as having a consistent type (eg currency). To reference the 34th row’s profits, one might write something like “Profit.34” or, if it’s a relative reference within row 34, by something like “myRow.Profit”. Relative references are usually distinguished from absolute references by similar mechanisms.
Utopian spreadsheets default to having very few types and modifiers, but cells can be modified to add more. For instance, there is no type for currency in a default spreadsheet, since currency is culturally specific and might change over time. Instead, to talk about money, the top-level cell of the spreadsheet could be given a modifier that adds “US Dollars” as a type for all the cells contained within. Types are written in a programming language in a way that specifies how they encode and render the data, as well as other features like automatically correcting invalid input (e.g. rounding to the nearest cent). Which programming language is used to specify types? This, too, is customizable. The only constraint is that the type code provide an interface which specifies the rules in a standard way.
Similarly, cells in a Utopian spreadsheet do not have any default way to reference other cells or to be interpreted as formulae. To calculate 2+2, one must first modify the cell to specify the language. For example, one could mark the top-level cell of the spreadsheet as using Excel’s language, which would add functions like TEXTBEFORE, and then mark a specific column to use Google Sheets’ language, giving access to QUERY. More realistically, one can mark specific cells as computational cells that use powerful languages like Python or R, but have the ability to reference the spreadsheet data as though it were an input to the function being defined.
Code that affects an entire spreadsheet can be written as a modifier for the top-level cell. This not only allows custom functions to be defined, but also theoretically gives access to interoperability with other files on either the local machine or over the network. Code can also be sandboxed to particular sections of the spreadsheet and given resource limits, reducing bloat. It is standard when writing a formula to indicate whether it should be re-run manually, or whether it’s fast/safe to re-run whenever the input data changes. These features in concert allow Utopian spreadsheets to handle advanced data analysis and full-scale databases.
Customization naturally adds layers of complexity and fragmenting, but Utopia handles this through standards, rather than limits on the software. If you want to use a fancy new font, go ahead, but also recognize that by doing so you’ll be increasing the file size and potentially making things worse for other users. Businesses and cultures within Utopia gravitate to de-facto loadouts for how spreadsheets get used, but these are in constant competition with each other and go through waves of stylistic refinement as cultures settle on how to use the power of their tools.
We could go over many other features in depth, such as embracing version control to help spreadsheets maintain local undo histories in an efficient way, or the emphasis on functional programming standards and strong typing. We could talk about how Utopian spreadsheets can sort and view data without fundamentally moving it, can hold images as first-class data (including having graphs that are generated by formulae), and of course have basic stuff like the ability to be collaboratively edited in the cloud by multiple users. But ultimately, all these are downstream from the most important difference between how Utopia handles spreadsheets and how Earth does:
Utopia treats spreadsheets as the first-class tool for handling data of all kinds, including for input, heavy-duty analysis, and presentation. Much like our world has a meme of “this meeting could’ve been an email,” Utopia has notions like “this website could’ve been a spreadsheet.” Utopia makes a few tradeoffs in different places, but it mostly achieves superior design by recognizing the primacy of tabular data and pushing the underlying principles to the limit.
What about other tessellations, like hexagons? As much as I love me some hexagons, they’re rarely the most intuitive way to organize things. While you can align things according to rows+diagonals (or columns+diagonals (see! already there’s an unnatural question: which orientation is best?), you can only use one diagonal (which??) for tracking an independent axis. Once you’ve picked a meaning for rows and one of the diagonals, the other diagonal axis usually just sits there uselessly. The main application for hex grids (and other patterns) is discretizing space, not abstract organization.
Text secretly being numbers is basically how computers can process it. A very easy way to see the equivalence is to consider base 36, which starts with the digits 0-9, then 10=A, 11=B, and so on up to Z=35. Numbers written in this format will look like “HELLO” (ie 29,234,652 when written in decimal). Expand to base 40 to add spaces and punctuation. Expand to base 256 to add lowercase letters, special symbols, and other alphabets. Et cetera.
One could make the argument either way, and I went back and forth in writing the essay about which is most natural. I think the best strategy is probably to simply have the orientation be part of the spreadsheet’s format. In this essay I’ll default to lists of columns.
If your lists have finite length and your numbers have finite digits, it’s trivial to encode them by rendering them as text and then treating the text as a number. But even infinite lists of numbers that each require an infinite number of digits (e.g. after the radix point) can be mapped losslessly onto the real numbers (or even just the numbers between 0 and 1). This can be done by generalizing the proof that one can represent a pair of real numbers as a single real number by interleaving the digits in some base. (This is a different proof than the existence of a bijection for natural numbers; an important difference is that digit interleaving is not one-to-one, since 0.999… = 1.0, but they have very different embeddings.)
Modern spreadsheets are vague about whether “bold” is a thing that applies to entire cells or whether it simply applies to the text data within the cell. In my conception, there is a default ability to bold entire cells, but not any text data within cells. To style individual parts of text, one needs a richer data type than strings, such as the Utopian equivalent of html or markdown.
If you’re 0-indexing, then A=0 and the successor to Z should be BA. If you’re 1 indexing then the successor to Z should be A_, where _ is whatever symbol you’re using for 0. Spreadsheet column names are madness.
Do you think the problem is that spreadsheet designers are too unimaginative? Or is it that there is little user demand for more complex and flexible spreadsheets? In other words, is the complexity and flexibility need being met elsewhere in a more efficient way?